

Challenge
Develop a custom election forecast model to simulate Electoral College outcomes in the final month of the 2024 U.S. presidential race, incorporating polling data, historical patterns, and state-level voting correlations.
Overview
In the final month of the 2024 U.S. presidential campaign, I built a custom election forecast model using Microsoft Excel to simulate potential Election Day outcomes and identify the most likely Electoral College scenarios. Although not as sophisticated as the forecasts on sites such as the former FiveThirtyEight.com, my model factored in state-level polling data, historical voting patterns, and the correlations among states that tend to vote similarly in presidential elections.
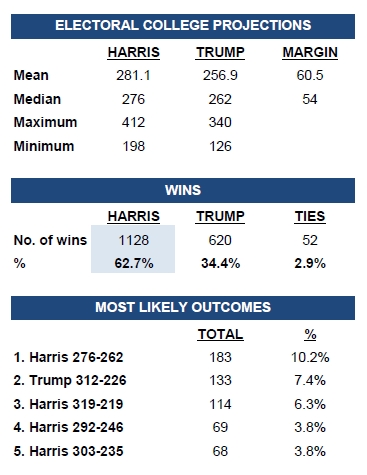
The model ran 1,800 daily simulations of the presidential race between Republican Donald Trump and Democrat Kamala Harris. By introducing random variability to account for uncertainty, I was able to estimate the odds of each candidate winning and the most likely electoral vote distributions.
Each day from October 6 through Election Day, I updated the model to produce a new forecast dashboard that included:
- The top five most likely electoral outcomes
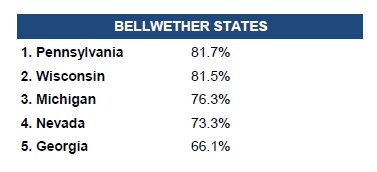
- The five bellwether states with the strongest predictive power
- Projected popular vote percentages
- State-level probabilities for each candidate
My Role
Creator, data analyst: This was a solo personal project, not part of my work as a professor. For updated daily state polling data, I relied on the website Electoral-Vote.com, which compiled state polls conducted by nonpartisan pollsters. Only polls conducted within the past month were used in the model, up to a maximum of the 5 most recent polls, with the most recent poll weighted more heavily. I used the results of past presidential elections to determine which states tend to vote similarly and to help forecast the outcomes in states where no polling data were available.
Tools
Microsoft ExcelInsights and Impact
Final forecast: Throughout the period, Harris had an advantage over Trump. On Election Day, the model gave Harris a 62.7% chance of winning, but it also identified Trump’s actual winning result (312–226 electoral votes) as the second-most-likely outcome, capturing a realistic range of scenarios.
Skills highlighted: This project demonstrated my ability to design a probability-based simulation model with structured logic, my proficiency in using advanced Excel formulas and lookups, and my skills in communicating complex forecasts through summary reports and dashboards.
Deliverables
Daily prediction Excel spreadsheets and PDF summary reports for Oct. 6-Nov. 5, 2024, are available, along with more information about the model and a summary spreadsheet with the day-by-day breakdown. NOTE: The spreadsheets might need to be downloaded and opened in Excel to display properly. The 1,800 simulations are spread across 60 sheets in the daily Excel files (“Runs1”-“Runs60”), and the forecast for the day is in the final “Results” sheet.
