

Challenge
Use data analysis and visualization tools to uncover trends in national, state, and institutional-level journalism degree completions, identify growth areas, and track regional shifts affecting the future pipeline of journalism talent.
Overview
As the news industry contracts, college journalism programs are struggling to attract and retain students. To explore trends in journalism school enrollment, I conducted a quantitative analysis of U.S. journalism degree completions from 2012 to 2019. Working with a large dataset from the National Center for Education Statistics (NCES) and Data USA, I used SQL to query and aggregate data by year, state, region, and institution type. I provided context by using Excel and functions such as VLOOKUP to combine the journalism degree data with additional state and regional data, including population figures and postsecondary enrollment numbers. I then created charts, tables, and maps in Datawrapper to highlight national trends, program “hot spots,” and regional shifts.
The analysis resulted in a two-part series on Medium:
- Part 1 identified overall national trends and differences between public vs. private and 4-year vs. 2-year institutions, as well as specific universities that saw significant enrollment growth amid the broader decline in journalism degrees.
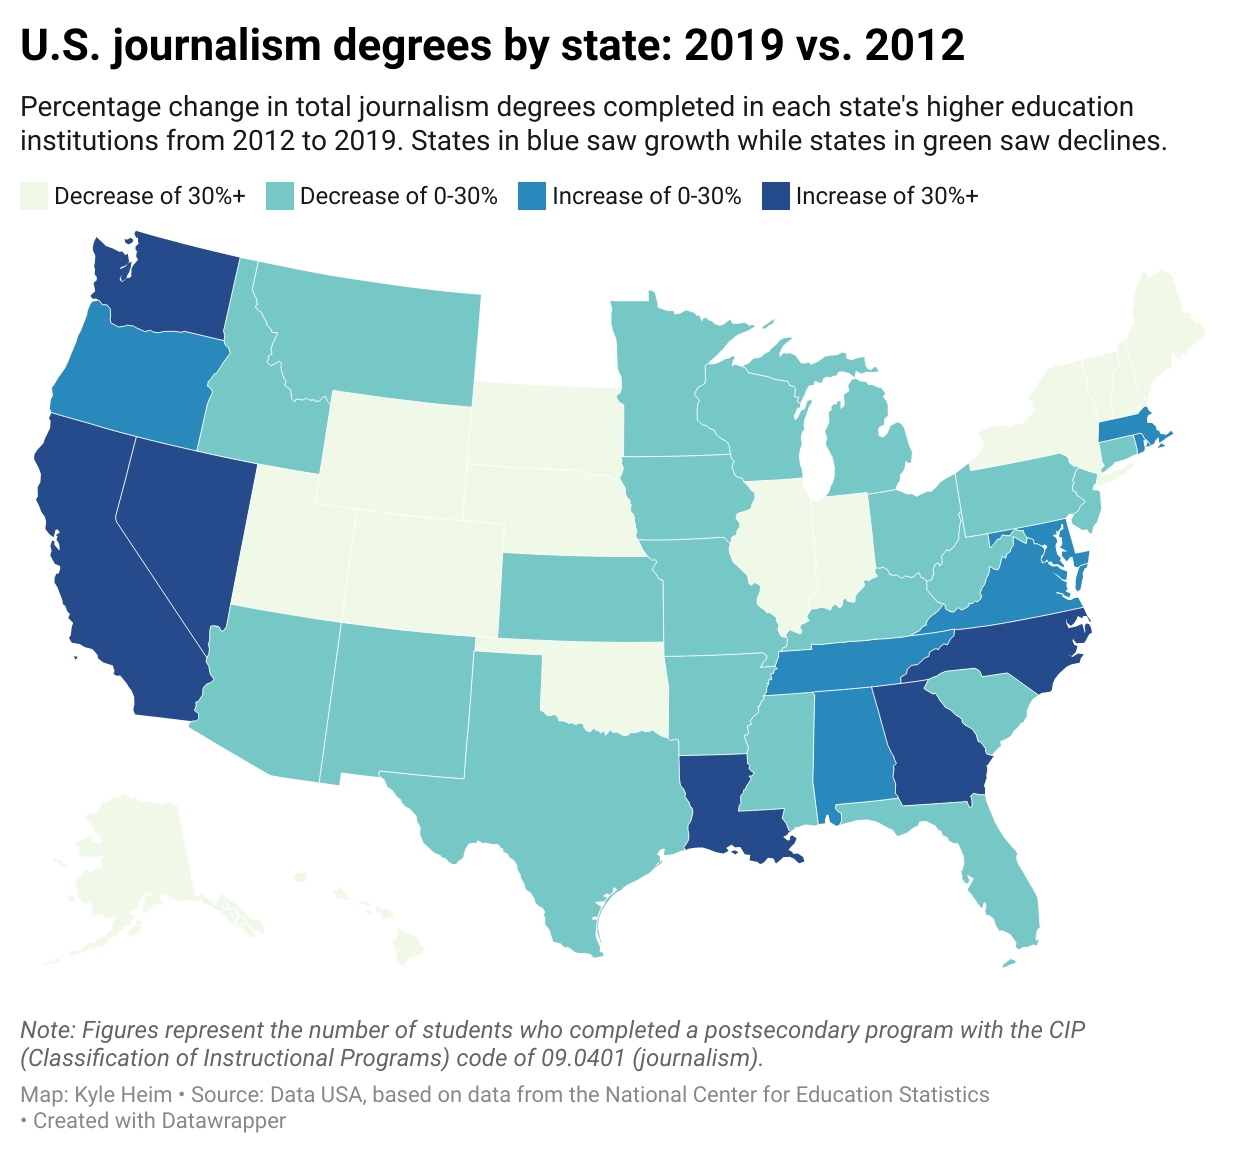
- Part 2 delved into state and regional trends, along with correlation testing in SPSS to examine links between degree completions, population shifts, and overall higher education enrollment.
My Role
Data analyst, researcher: This analysis began as a project for a 2021 Knight Center for Journalism in the Americas online course on SQL and Datawrapper (“Hands-On Data Journalism: Techniques of Analysis and Visualization”).
Tools
SQL Datawrapper Microsoft Excel SPSSInsights and Impact
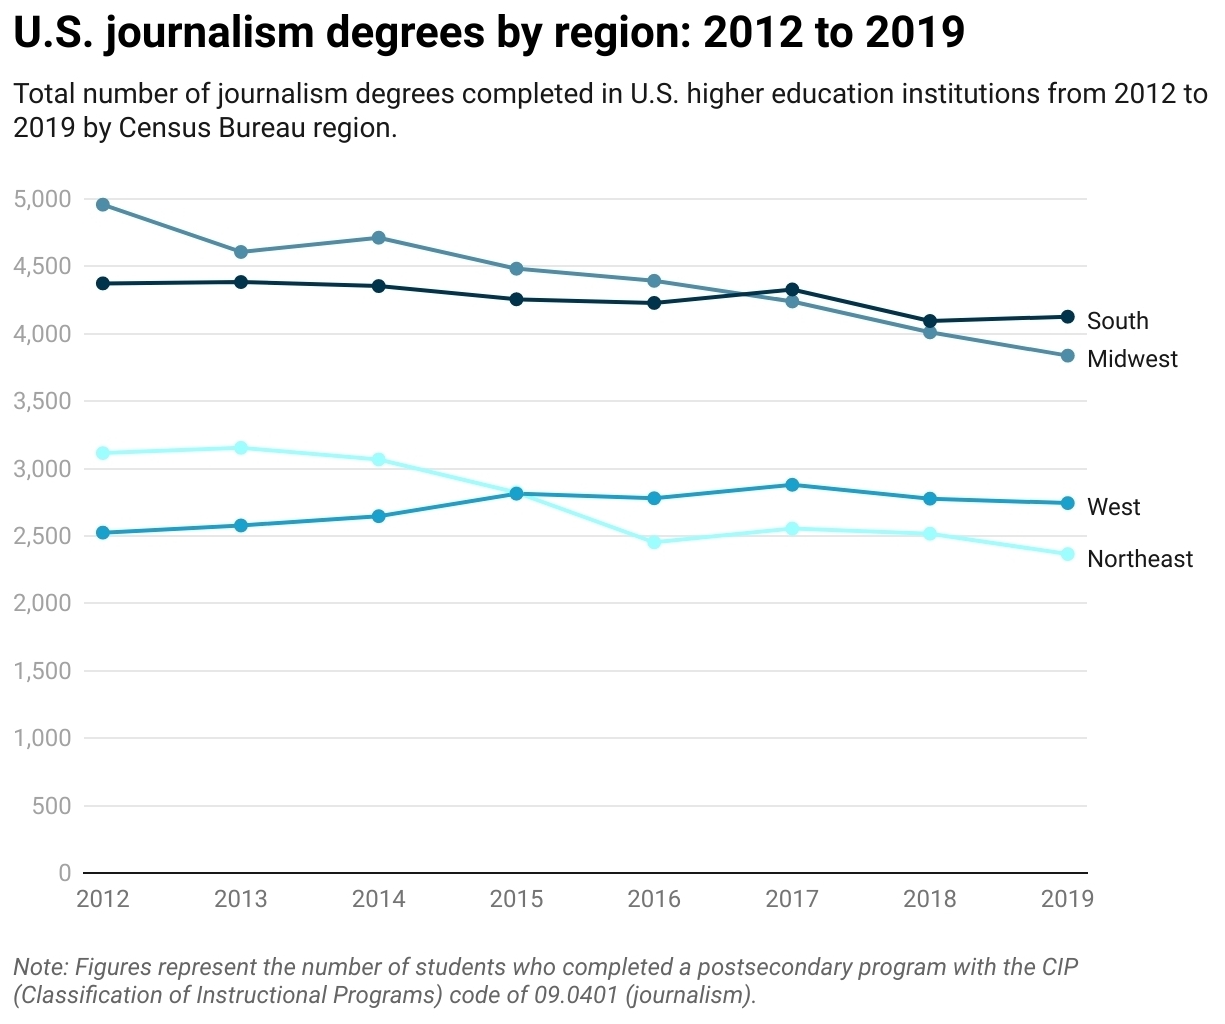
Key findings: Overall, U.S. journalism degree completions fell by 12.7% from 2012 to 2019, but 2-year institutions bucked the trend with a 113.6% increase. While the Midwest had the most journalism degrees overall during the eight-year period, the region’s dominance waned as programs in the West and South gained momentum. Six states — three in the South and three in the West — saw growth of 30% or more. This geographic shift cannot be explained solely by broader trends in college enrollment and state population.
Skills highlighted: This project demonstrated my ability to perform SQL-based data querying, filtering, and aggregation, create informative data visualizations, uncover patterns in large datasets, and engage in data-driven storytelling for public audiences.
